Solar Photovoltaics Industry
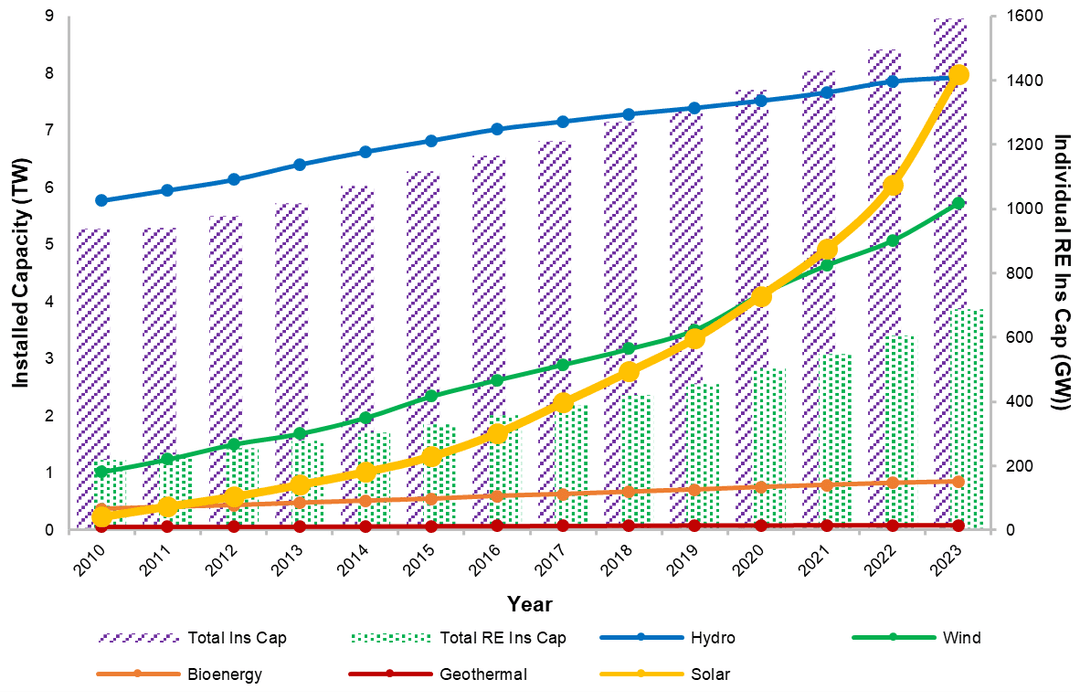
Mankind has acknowledged the crucial role that the environment plays in the ecosystem and governments across the world have been constantly thriving towards protecting and preserving the environment through sustainable development. This ecological drive has fuelled the integration and furtherance of renewable sources of energy globally. The International Renewable Energy Agency (IRENA) reports that the global electricity capacity amounts to around 8.96 TW in 2023, out of which 3.87 TW, or 43.2%, is supplied from renewable sources of energy (IRENA, 2024). Moreover, figures show that solar PV energy has been the most successful and promising form of renewable energy, with more than 1200% increase over the last decade, from 104.3 GW in 2012 to 1.42 TW in 2023, and projected global installed capacity of 2.84 TW and 8.52 TW by 2030 and 2050, respectively (IRENA, 2019, 2024), as shown in the figure below.
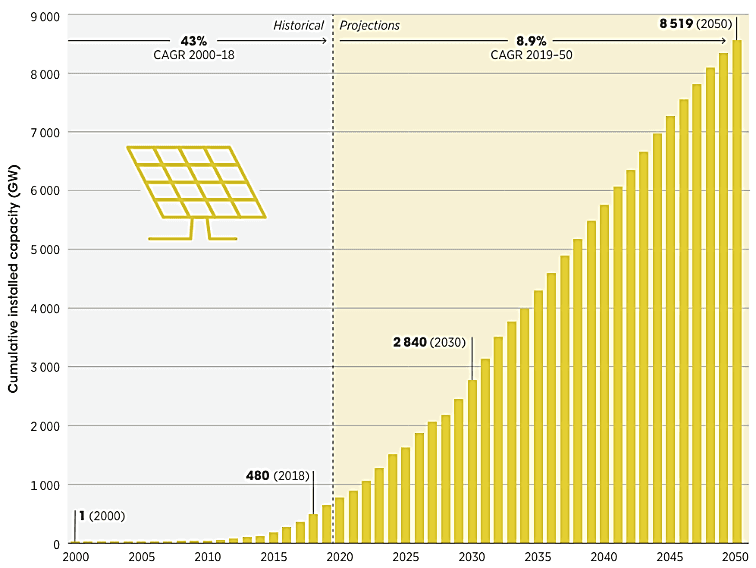
The figure below illustrates how solar PV has outpaced its counterparts on a global platform.
Additionally, the Levelised Cost of Electricity (LCOE) of solar PV energy has been continuously decreasing reaching USD 0.049/kWh in 2022, from USD 0.445/kWh in 2010 (IRENA, 2023b), which is way lower than its counterparts. This value is expected to further decrease to USD 0.08-0.02/kWh and USD 0.05-0.01/kWh by 2030 and 2050, respectively (IRENA, 2019). Moreover, the worldwide employment in renewable energy in 2022 amounts to around 13.7 million, out of which, 4.9 million jobs are from solar PV industry, followed by 3.58 million jobs in the bioenergy sector (IRENA, 2023a). The employment values for solar PV industry are expected to reach 11.7 million and 18.7 million by 2030 and 2050, respectively (IRENA, 2019). Additionally, the share of women in full-time positions in the solar PV industry is 40% globally, which is almost twice as those of the wind sector and oil and gas industry, thus positioning solar PV as the leading renewable energy technology in gender equality promotion (IRENA, 2023a).
With regard to installed capacity, it should be noted that similar trends have been observed in the local Mauritian context whereby solar PV has experienced an astounding penetration rate of around 10.6 MW increase in installed capacity per year, as shown in the figure below.
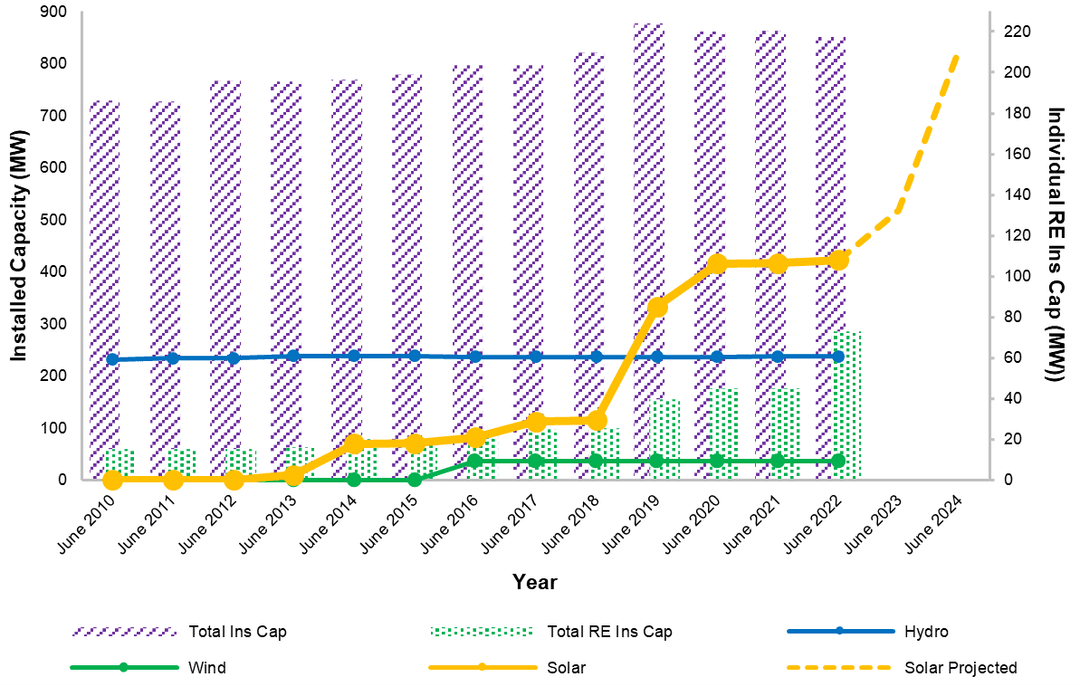
With the commitments that the government took in the national budgets 2022/23 and 2023/24, the total installed capacity of solar PV is projected to around 210 MW by June 2024.
IRENA, 2019. Future of Solar Photovoltaic. Available at: https://www.irena.org/Publications/2019/Nov/Future-of-Solar-Photovoltaic
IRENA, 2024. Renewable Capacity Statistics 2024. Available at: https://www.irena.org/Publications/2024/Mar/Renewable-capacity-statistics-2024
IRENA, 2023a. Renewable energy and jobs: Annual review 2023. Available at: https://www.irena.org/Publications/2023/Sep/Renewable-energy-and-jobs-Annual-review-2023
IRENA, 2023b. Renewable Power Generation Costs In 2022. Available at: https://www.irena.org/Publications/2023/Aug/Renewable-Power-Generation-Costs-in-2022
History
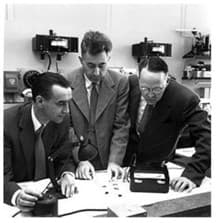
The photovoltaic phenomenon was discovered in the early 1950s by a group of engineers (Daryl Chapin, Calvin Fuller and Gerald Pearson) at the Bell Labs in USA whereby they produced the first silicon-based solar PV cells (Si-PV cell) with only 4% efficiency as shown in the figure below.
Basically, a solar PV cell absorbs energy from photons from light whereby electrons become free to move and conduct electricity across a load. In other words, a solar PV cell can be described as a transducer that converts light energy into electrical energy. Since then, continuous research and development have been done in the field and the photovoltaic technology has experienced significant expansion and advancements in terms of technological diversification, PV cell configurations, efficiency of operation, and real-life applications, amongst others. The major milestones of the photovoltaic technology have been summarised in the table below for a more convenient glance at the evolution.
1950 - 1954 | Bell Labs produces first Silicon-based solar PV cell with 4% efficiency. |
1958 | Satellite applications of Si-PV cells in Vanguard I, Vanguard II, Sputnik-3 and Explorer III. |
1960 | 14% efficiency of Si-PV cells by Hoffman Electronics. |
1963 | Sharp Cooperation produces first solar PV modules. |
1963 - 1970 | Offgrid and standalone solar PV systems installed in remote locations such as lighthouse, warning lights, railroad crossing. |
1973 | University of Delaware builds “Solar One”, one of the world’s first grid-tied solar PV powered residences. |
1978 | Birth of Feed-In-Tariff (FIT) in USA and thereafter in various countries across the globe, with inception in Mauritius in 2011. |
1982 | The first solar PV megawatt-scale power station commissioned in Hesperia, California. The system had a 1 MW capacity, developed by ARCO Solar, with modules on 108 dual-axis trackers. |
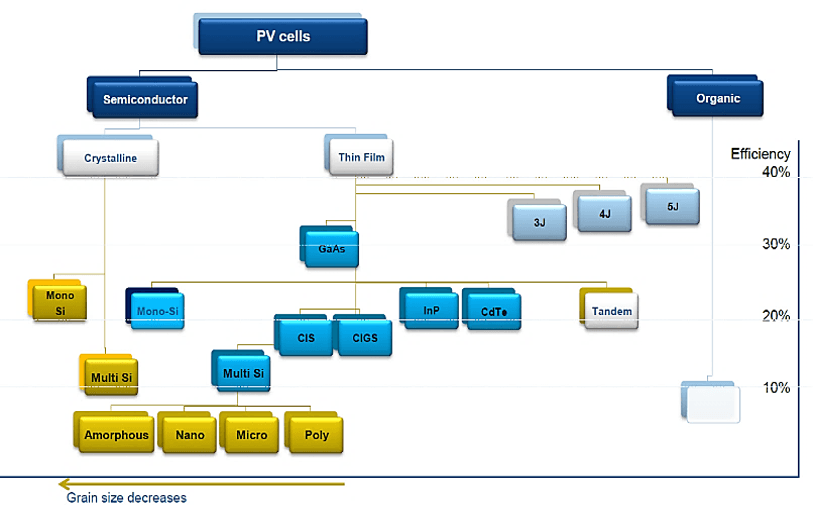
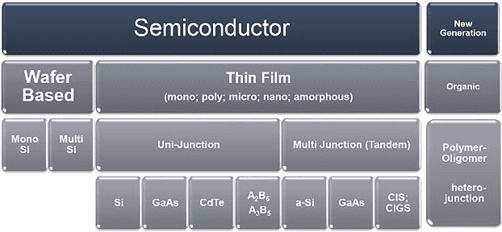
Moreover, the below figure illustrates the solar PV technology family tree in terms of efficiency of operation and material grain size used in the manufacturing process. There exist three main generations of solar PV technology: (a) GEN-1 Monocrystalline Si-based (>35% of Market, <25% Efficiency); (b) GEN-2 - Multi crystalline Si-based (<55% of Market, <20% Efficiency); and (c) GEN-3 Thin Film (<10% of Market, <10% Efficiency).
Solar Terminologies
Fundamental parameters have been defined below in a bid to facilitate navigation on the website and understanding of the different solar concepts by users.
- Irradiance represents the solar power intensity incident on a surface and is measured in W/m2.
- Solar radiation, irradiation and insolation refers to the solar energy intensity incident on a surface and is measured in Wh/m2.
- Global horizontal irradiance (GHI) is the total amount of solar power intensity incident on a horizontal surface.
- Direct normal irradiance (DNI) is the portion of GHI that is incident on a horizontal surface, in a straight line from the Sun.
- Diffuse horizontal irradiance (DHI) is the portion of GHI that is incident on a horizontal surface from indirect paths.
- Plane of Array (PoA) irradiance is the solar power incident on the surface of a tilted PV module with a given azimuth.
- Global horizontal insolation is the total amount of solar energy intensity incident on a horizontal surface.
- Plane of Array (PoA) insolation is the solar energy intensity incident on the surface of a tilted PV module with a given azimuth.
- A PV cell is the most elementary device that exhibits the photovoltaic effect (the direct non-thermal conversion of radiant energy into electrical energy).
- A PV module is the smallest complete environmentally protected assembly of interconnected cells.
- A PV string is a circuit of one or more series-connected PV modules.
- A PV array is an assembly of electrically interconnected PV modules, PV strings or PV sub-arrays comprising all components up to the DC input terminals of the inverters, charge controllers, DC loads, or other power conversion equipment, excluding PV array mounting structure, tracking mechanism, thermal control, and other such components.
Semiconductors and P-N junction
Solar PV cells are basically made from semiconductors since there exist an energy band gap between the valence and conduction energy bands. Valence and conduction bands are energy bands which may be described as a large number of closely spaced energy levels existing in materials. On the other hand, a semiconductor is a material whose resistivity is within 10-4 to 108 Ωm and whose conductivity can be locally modified through the introduction of impurity atoms in the crystalline lattice.
Semiconductors can be classified into two categories:
- elementary - consisting of one type of atoms covalently bonded in two interpenetrating face centred cubic lattice (like Silicon and Germanium); and
- compound - consisting of two or more atoms with mixed ionic-covalent bonds in interpenetrating face centred cubic lattice (like Gallium Arsenide and Cadmium Telluride).
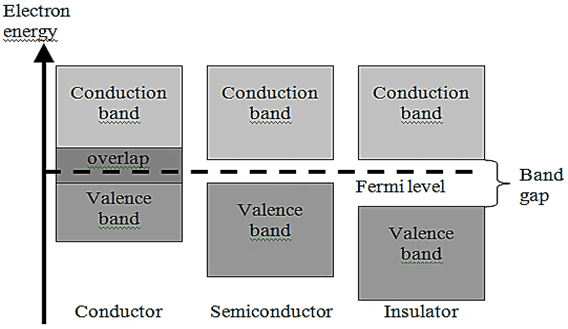
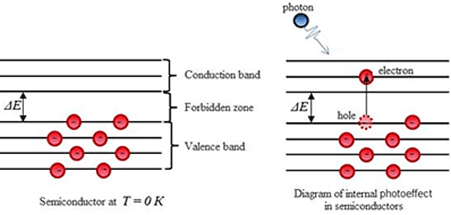
In the configuration of a semiconductor, electrons from the valence band absorb energy from photons of light (light exhibiting wave-particle duality) and get promoted to the conduction band whereby they are free to move, thus resulting in an electric flow of current when the circuit is closed. The figure below illustrates the difference in energy bands of conductors, semiconductors and insulators, which explains why semiconductors are used to make solar PV cells. The Fermi Level refers to the highest energy level that an electron can occupy at the absolute zero temperature (at 0 K). In conductors, there is an overlap of the valence and conduction bands whereby electrons cannot create an electric flow by absorbing energy while, in insulators, the energy band gap is too large for electrons to move to the conduction band. To that end, most PV technologies make use of pure crystalline Silicon (Si), a semiconductor, which is extracted from sand (Silicon Di-Oxide, SiO2, also known as Silica) through a vigorous purification process.
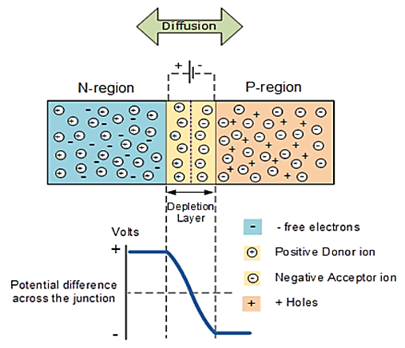
However, there are two types of semiconductors, namely, intrinsic and extrinsic, whereby the former refers to a pure semiconductor material with no impurity atoms (like Silicon) while an extrinsic semiconductor can be formed from an intrinsic semiconductor by adding impurity atoms to the crystal through the process known as doping. When Silicon is doped with small amounts of a pentavalent atom (like Phosphorus, Antimony, Arsenic and Bismuth), four of the five valence electrons of the pentavalent atom participate in covalent bonding with adjacent Silicon atoms with one electron left to move freely. This results into an N-type semiconductor material. Similarly, when Silicon is doped with small amounts of a trivalent atom (like Boron, Indium and Gallium), all three of its valence electrons participate in covalent bonding, resulting in an electron vacancy or a hole with one of the adjacent Silicon atoms. This results into a P-type semiconductor material. Dopants that create holes are known as acceptors and those that donate electrons in the crystal are known as donors. Nevertheless, the N-type and P-type semiconductor materials, on their own, are electrically neutral and do not display electrical capabilities. However, when joined/fused together, these two semiconductor materials form a P-N junction which, under certain conditions, enable electric current flow through movement of electrons. A P-N junction can be described as an interface between P-type and N-type semiconductor materials in a single crystal as shown in the figure below. The “N” side contains freely-moving electrons (negative), while the “P” side contains freely-moving electron holes (positive).
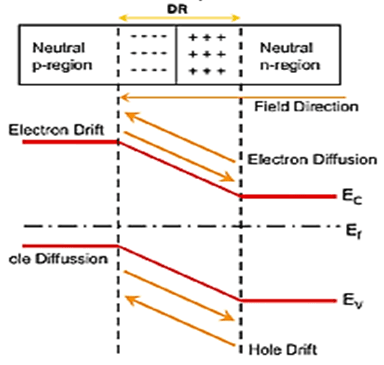
When a P-N junction is formed from a single Si crystal, some of the free electrons in the conduction band, as a result of the donor impurity atoms, migrate at the junction boundary to fill up the holes in the P-type material as shown in the figure below. While doing so, the electrons leave behind positively charged donor ions on the N-type material. Similarly, the holes from the acceptor impurity (P-type material) migrate across the junction in the opposite direction into the region where there are large numbers of free electrons. This process continues until the number of electrons which have crossed the junction have a large enough electrical charge to repel or prevent any additional charge carriers from crossing over the junction. Eventually a state of electrical equilibrium occurs, producing a “potential barrier” zone around the area of the junction as the donor atoms repel the holes and the acceptor atoms repel the electrons. This area around the P-N Junction is now called the Depletion Layer. The presence of impurity ions on both sides of the junction establishes an electric field across the depletion layer with the N-side at a positive voltage relative to the P-side (since the N-type has lost electrons). This electric field results in a “built-in potential difference” across the junction which acts as a potential barrier. A suitable positive voltage (forward bias) applied between the two ends of the P-N junction can supply the free electrons and holes with the extra energy to overcome this potential barrier. For instance, at room temperature, the typical voltage across the depletion layer for Silicon is about 0.6-0.7 V while that for Germanium is about 0.3-0.35 V. Altogether, it can be said that the P-N junction exhibits rectifying I-V characteristics and the resulting electronic device is commonly called a P-N junction Diode.
Substantial research and development have been and is still being done is the sphere of the solar PV cell material use, the results of which have been the development of solar PV cell made from different materials each of their own characteristics. The eventual aim is to obtain a solar PV cell with the highest possible efficiency at the lowest possible cost. Rationally, the availability of the material used to manufacture the solar PV cell will govern the price. Since, sand is readily available, Silicon-based solar PV technologies bears the lowest prices. Moreover, the manufacturing process of the different technologies also impacts on the price. The figure below summarises the solar PV cell family tree with respect to the different technologies. Ideally, efficiency of a solar cell depends on the construction properties of the solar cell and the optical properties of the material from which the solar cell is made. The optical property is characterised by the absorption coefficient which describes the number of photons that can be absorbed per cm depth. This depends mainly on the internal crystalline structure and the presence of boundary defects that act as electron traps in the solar PV cell. Hence, the absorption coefficient indicates the penetration depth of photons. A low absorption coefficient represents a high penetration depth. Photons with energy greater than the energy band gap of the material will be absorbed, resulting in electron-hole pairs (EHPs). However, only photons landing in the absorber/active region will generate EHPs that may contribute to the conduction process. This explains the overall low light to electricity conversion efficiency of solar PV cells, generally not exceeding 25% for Silicon-based and up to 35% for Galium-Arsenide based solar PV cell.
Solar Cell Operation
Solar cells work on the principle of photovoltaic effect. The latter refers to the phenomenon whereby electrons are emitted, when light is incident on a material, resulting in the generation of a photo-voltage and photo-current. Basically, photovoltaic effect may be defined as the direct conversion of light into electricity at atomic level. A photovoltaic cell (PV cell) may be described as a specialised semiconductor diode that converts light into a direct current (DC). Based on the material used, a PV cell may also convert visible light, infrared (IR) and/or even ultraviolet (UV) radiation into electricity. During the photovoltaic process, when light is incident on a PV cell, a portion of the energy possessed by the photons of light (light exhibiting wave-particle duality) is absorbed by the electrons. If this absorbed energy (energy possessed by the photons) is greater than the material’s energy band gap, the electron from the valence band gets promoted to the conduction band (forming an electron-hole pair: charged carriers) as shown in the figure below, where they are free to move. As a result, electric current flows through the PV cell if circuit is closed. The incident photon energy, which is dependent on the wavelength of the incident light, is given Equation 10. Consequently, since each semiconductor (elementary or compound) has a different energy band gap, it is correct to say that only light with a certain wavelength will result into photovoltaic effect in a given material, given by Equations 11-13. As a result, in order for photons to be absorbed by a given material with a given energy bandgap, the wavelength of the incident photons should be lower than the limiting wavelength from Equation 13. This maximum wavelength (λc) is known as the critical wavelngth.
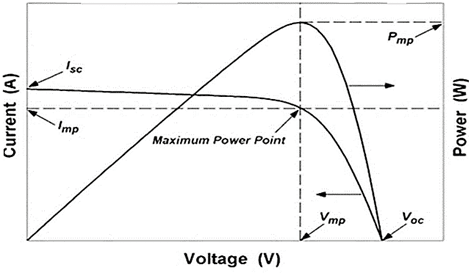
The performance of a PV cell may be interpreted as the output power delivered by the cell which is obtained by multiplying the output voltage and the output current of the cell (Pout = Vout x Iout), given the DC nature of the power produced. The figure below illustrates typical current-voltage and power-voltage characteristic curves of a PV cell. The current-voltage displayed is for a varying load from zero ohm to a very large resistance. Thus, it can be said that the output current and voltage of a PV cell will depend on the load connected and thus will operate at only at a given point on the curve. The power-voltage is simply obtained by plotting Pout against Vout. Basically, there are three points of interest in an I-V curve of a PV cell, namely the short circuit current point (0,Isc), the open-circuit voltage point (Voc,0) and the maximum power point (Vmpp, Impp). The maximum power point(Vmpp, Impp) is the point where the cell will deliver maximum power (Pout = Pmax = Vmpp x Impp). At the open-circuit voltage point (Voc ,0), the maximum voltage is achieved when no current is being drawn from the circuit (Pout = Voc x 0 = 0 W). At the short circuit current point (0,Isc), maximum current is produced by the cell with no load resistance, implying no potential difference across the load (Pout = 0 x Isc = 0 W).
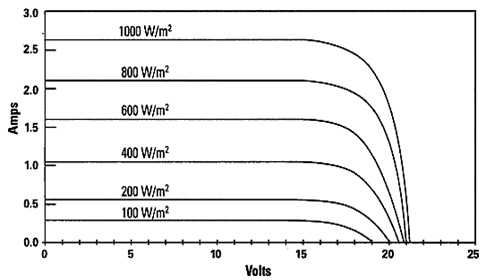
Generally, a PV cell, by extension PV module or array, is expected to work at its highest efficiency rate (maximum output power). Empirical studies have shown that there are several factors that govern the output power of a PV cell. Firstly, the load resistance connected to the PV cell will determine the point (the current and voltage values) at which the PV cell will operate. Hence, the load resistance should be selected such that the PV cell is working near the maximum power point. Another main factor is the incident solar irradiance (G) on the PV cell. From the figure below, it can be seen that as the intensity of light increases (with temperature being constant), the output current also increases. This is because, a higher intensity implies that more photons are incident on the PV cell, causing the output current to increase as more electrons would move from the valence band to the conduction band. On the other hand, the output voltage increased rapidly at low intensities with slight increase at high intensities. This is because the output voltage has a logarithmic behaviour with output current as per the Shockley’s Diode Equation. Altogether, the shape of the I-V curve remains unchanged, but shifts upwards with increasing light intensity at a given temperature. Thus, it may be said that the output power of the cell increases with higher light intensity.
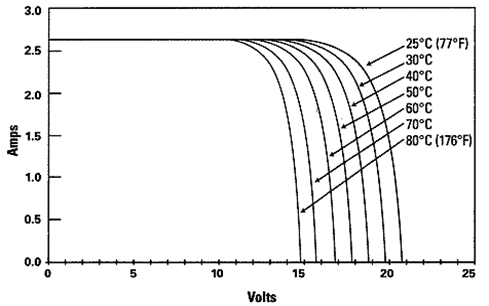
Similarly, cell temperature also affects the performance of a PV cell. From the figure below, it can be seen that as the cell temperature increases, the open-circuit voltage decreases. This is because, as temperature increases, the intrinsic carrier concentration also increases whereas the energy band gap decreases. The intrinsic carrier concentration is the conduction band's number of electrons per unit volume or the valence band's number of holes per unit volume. This increase in intrinsic carrier concentration results in a decrease in the built-in potential which represents the value of open-circuit voltage. Moreover, since the energy band gap decreases, the critical wavelength increases resulting in a larger number of photons being now eligible to be absorbed. This implies that an increase in temperature should result in an increase in output current. However, the number of photons in the higher wavelength part of the solar spectrum is low, resulting in negligible effect in output current. Altogether, the shape of the I-V curve still remains unchanged, but shifts backward with increasing temperature for a given light intensity. Thus, it may be said that the cell will operate less efficiently as the cell temperature rises.
One-Diode Model
The one-diode model mathematically describes a PV cell as a current source in parallel with a diode (basically a P-N junction), including a series resistance (Rse) and a parallel resistance (Rpa) as shown in the figure below.
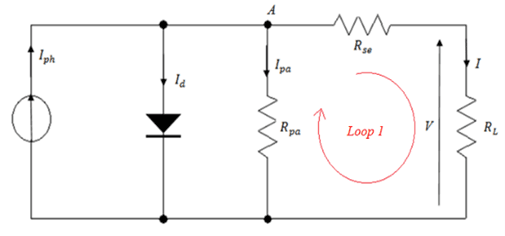
Using Kirchhoff’s current law at node A, the output current (I), photo-current (Iph), diode current (Id), and parallel current (Ipa) are given by Equation 14, whereby the Iph and Id are given by Equation 15 and Equation 16, respectively. Moreover, using Kirchhoff’s voltage law across loop 1, Ipa is given by Equation 17. The diode ideality factor (a) is a measure of how much the practical diode differs from an ideal diode. The junction thermal voltage (VT) is a characteristic voltage that relates current flow in the P-N junction to the electrostatic potential across it. The diode saturation current (Ios) is the reverse current in a diode which is caused by diffusion of minority carriers from the neutral region to the depletion region in a P-N junction. Altogether, the typical I-V characteristic relationship of a single diode model of a PV cell is given by Equation 21 below.
| \(I= I_{ph} - I_d- I_{pa}\) | Eq 14 | Ga is the incident global horizontal irradiance |
| \(I_{ph} = \frac{G_a}{G_n} [I_{ph,n} + K_{i}∆T ]\) | Eq 15 | Gn is the nominal global horizontal irradiance (1000 W/m2) |
| \(I_d = I_{os} [exp(\frac{V + I R_{se}}{V_{T}a}) - 1]\) | Eq 16 | Tnominal is the nominal temperature (25˚C) |
| \(I_{pa} = \frac{V + I R_{se}}{R_{pa}} \) | Eq 17 | Ki is the temperature coefficient of photocurrent |
| \(I_{os}= I_{os,n} ( \frac{T_{nominal}}{T})^3~exp[\frac{q E_g}{ak} (\frac{1}{T_{nominal}} - \frac{1}{T} )] \) | Eq 18 | Ios is the diode saturation current given by Equation 18 |
| \(I_{os,n} = \frac{I_{sc} + K_i ∆T}{ exp[(\frac{V_{oc} + K_{v}∆T}{a~V_{T,n}})- 1]} \) | Eq 19 | a is the diode ideality factor |
| \(V_T = \frac{kT_{cell}}{q} \) | Eq 20 | Tcell is the cell temperature |
| \( I = [ \frac{G_a}{G_n} [ I_{ph,n} + K_i ∆T ] - I_{os} [ exp ( \frac{V + IR_{se}}{V_Ta} ) - 1 ] - [ \frac{V + I R_{se}}{R_{pa}}] ] \) | Eq 21 |
Regulatory framework
Another very important aspect in implementing solar PV projects is the adherence to the local utility legal framework. It is essential to abide by the relevant laws and regulations when installing the solar power systems, especially for grid-tied systems. Thus, the criteria for connection to the national grid has to be respected and necessary coordination with the utility grid provider has to be made. The Electricity Act 1939 defines how the electricity services (generation, transmission, distribution and bulk supply of electricity) are to be delivered to the customers (MEPU, 2024). The Electricity Act 2005, yet to be proclaimed, will repeal the Electricity Act 1939 (CEB, 2024a). The main objective of the Electricity Act 2005 is to empower a Regulator, the Utility Regulatory Authority (URA), to oversee the electricity market in the country with more competition in the sector, particularly in electricity generation.
The Electricity Act 2005 also aims to:
- harmonise it with the Central Electricity Board Act 1963 for the proper functioning of the electricity market
- bring amendments to certain types of licences which may be issued under the Act by the URA
- temporarily maintain the single buyer model for smooth transition to the regulated market under the oversight of the URA and
- clarify certain provisions of the Act.
Additionally, the Electricity (Amendment) Act 2020 was enacted on 18 December 2020 which amended several provisions of the main act, the Electricity Act 2005, with an aim to clarify ambiguity while harmonising the act with other relevant legal instruments (CEB, 2024a).
On the other hand, the Central Electricity Board Act 1963 sets up the vertically integrated utility provider, the Central Electricity Board (CEB), with the object to prepare and carry out development schemes with the general object of promoting, coordinating and improving the generation, transmission, distribution and sale of electricity in Mauritius, including the building of new generation stations (CEB, 2024a). Moreover, the Utility Regulatory Authority (URA) Act 2004 was enacted in November 2004 to set up a regulatory framework for the electricity, water and wastewater sectors (MEPU, 2024). To this end, the Utility Regulatory Authority (URA) was established under Section 4 of the Act, which became operational only in 2016 when the Board was constituted.
Its main objects are to:
- ensure the sustainability and viability of the utility services
- protect the interests of consumers
- promote efficiency in both operations and investments in respect of utility services and
- promote fair competition in the utility services industry.
Another important institution is the Mauritius Renewable Energy Agency (MARENA) which was established under Section 3 of the Mauritius Renewable Energy Agency Act 2015 and became operational in 2016 (MEPU, 2024).
The main objectives of MARENA are to:
- promote the adoption and use of renewable energy with a view to achieving sustainable development goals
- advise on possible uses of liquid natural gas
- create an enabling environment for the development of renewable energy
- increase the share of renewable energy in the national energy mix
- share information and experience on renewable energy research and technology and
- foster collaboration and networking, at regional and international levels, with institutions promoting renewable energy.
Section 20 of the MARENA Act 2015 makes provision for the enactment of regulations regarding:
- the setting of standards and guidelines relating to renewable energy technologies
- accreditation mechanisms in respect of operators in the sector of renewable energy
- the criteria for approval of renewable energy projects and
- the levying of fees and charges.
As to date, no such regulations have yet been made under the Act. Additionally, other relevant regulations include, amongst others:
- Electricity (Safety, Quality and Continuity) Regulations 2022
- Electricity (Metering, Billing and Collection) Regulations 2022
- Electricity (Licensing, Registration and Fees) Regulations 2022 and
- Electricity (Transitional Licence) Regulations 2022 (CEB, 2024a).
Central Electricity Board (CEB), 2024a.Laws and Regulations. Available at: https://ceb.mu/company-profile/laws-and-regulations
Ministry of Energy and Public Utilities (MEPU), 2024. Legislations - Energy. Available at: https://publicutilities.govmu.org/Pages/Legislation/Energy.aspx
Grid codes
Several RE schemes have been introduced along with Grid Codes to facilitate integration of RE in the national grid. Grid Codes set out all the requirements relevant to the performance, operation, testing, safety, and maintenance of distributed generation connected to CEB's network. It outlines design parameter; protection requirements; power quality; power factor; network maintenance; safety, isolation and switching; metering; testing and commissioning; and maintenance, amongst others. To this effect, a series of Grid Codes have been published by CEB to accompany the various schemes whereby connection mechanisms are provided, detailing all the processes and the mandatory technical requirements of systems. In Mauritius, RE systems are classified as small scale (< 50 kW), medium scale (50 kW - 2 MW) and large scale (> 2 MW). However, there are two Grid Codes under the MSDG category, those being: (a) Grid Codes for MSDG 50 kW - 200 kW; (b) and Grid Codes for MSDG 200 kW - 2 MW. Some elements described in the Grid Codes include: required operating voltage and frequency ranges; requirements for Safety, Isolation and Switching; and required standards for PV modules, inverters, grid-connected PV system, and power quality; amongst others. The Grid Codes required standards are summarised in the table below (CEB, 2024b) and can be accessed from the CEB website.
SN | Description | Required Standards |
|---|---|---|
1 | PV Modules |
|
2 | Inverters |
|
3 | Grid-connection PV System |
|
4 | General Engineering Standards |
|
5 | Power Quality |
|
Central Electricity Board, 2024b. Grid codes. Available at: https://ceb.mu/projects/grid-codes
Renewable energy promotion mechanisms
Over the past decade, the government has relentlessly been fuelling and promoting the Renewable Energy (RE) sector in Mauritius through the relevant authorities/institutions. Numerous fiscal, financial, regulatory and technical energy promotion schemes/incentives have been announced in the annual budget speeches by the Minister of Finance, Economic Planning and Development over the years, many of which have already been implemented. Some of the main measures regarding the promotion of renewable energy and decarbonisation strategies have been summarised in the table below (MOFEPD, 2024a, 2024b). Altogether, it can be seen that particular emphasis is laid to the solar PV industry since Mauritius is a tropical island with abundant insolation throughout a calendar year, while the hydropower sector is, somehow, saturated and the wind power sector being in an embryonic stage.
You may view all the Renewable Energy Schemes which have been developed by the CEB here.
SN | Budget Year | Budget Paragraph | Measures announced |
|---|---|---|---|
1 | 2020/21 | 257-260 |
|
2 | 2021/22 | 43, 91-116 |
|
3 | 2022/23 | 179-216 |
|
4 | 2023/24 | 66, 92-94, 120-23, 130, 139, 181-202 |
|
5 | 2024/25 | 156, 199-211, 271-279, 345 |
|
Ministry of Finance, Economic Planning and Development (MOFEPD), 2024a. Past National Budgets. Available at: https://mof.govmu.org/Pages/Past-National-Budgets.aspx
Ministry of Finance, Economic Planning and Development (MOFEPD), 2024b. Budget 2024-2025. Available at: https://nationalbudget2024.govmu.org/index.html
Electricity grid readiness for RE
Electrical energy generated from renewable sources are highly stochastic and intermittent in nature due to the input energy (solar, wind, waves, etc) being a function of time and place which impacts on the resulting output electrical energy. As seen under (Solar Photovoltaics Industry), the global tendency is the increase in renewable sources of energy for electricity generation. Thus, the key characteristic for modern and future electricity grids is the ability to sustain significant variations on the grid due to a high share of renewable energy in the power generation mix. The intermittence of injected energy from renewable sources may result in highly fluctuating voltage and frequency as well as base power supply. Consequently, electrical grids now include Battery Energy Storage Systems (BESS) to store the excess energy injected to the grid at one moment in time, while acting as reserve energy sources for instances where production from renewable sources is reduced. This BESS technology is particularly useful for electrical grids with a high share of energy generated from solar power systems since there is no energy generation at night with the same base demand.
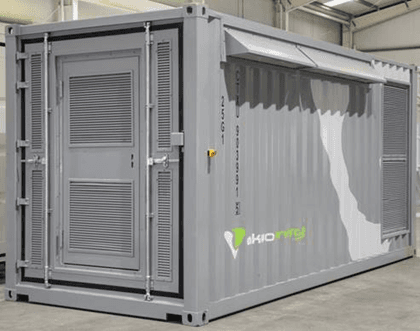
In the furtherance of 60% of energy generation from renewable sources and phasing out of coal by 2030, the Government of Mauritius has devised and implemented numerous mechanisms and incentives over the years, with solar PV being the leading technology, as seen under Renewable energy promotion mechanisms. As a result, the current installed capacity for solar PV is expected to increase substantially to reach around 400 MW by 2030. In this anticipation, the Central Electricity Board (CEB) proactively installed the first 2 MW grid-scale BESS at CEB Amaury Substation to enable high capacity storage of renewable energy in the grid (CEB, 2024c). The project was financed by the Green Climate Fund under the project “Accelerating the transformational shift to a low-carbon economy in the Republic of Mauritius” for which CEB was the implementing agency and the UNDP the supporting agency (CEB, 2024c). Later, CEB commissioned an additional 2 MW BESS at CEB Henrietta Substation, which marked the completion of the first phase of the project. Each BESS is made up of two containers of 20 ft housing 10 racks of Lithium ion batteries as shown in Figure 23 (CEB, 2024c). The second phase comprises installation of 4 MW BESS at CEB Jin Fei Substation, 4 MW BESS at CEB Anahita Substation, 4 MW BESS at CEB Wooton Substation, and 2 MW BESS at CEB La Tour Koenig Substation, reaching a total of 18 MW BESS.
Moreover, as seen under Renewable energy promotion mechanisms, the government:
- announced in year 2021 that an additional 22 MW BESS will be installed to increase the grid intermittence absorption capability to 40 MW;
- committed to the implementation of an additional 20 MW BESS at CEB Amaury Substation in year 2022; and
- announced the installation of a further 20 MW BESS at L’Avenir in year 2024.
Thus, the cumulative BESS capacity is expected to increase to at least 80 MW in the upcoming year. Additionally, CEB is also planning to install 1 MW BESS in Rodrigues (CEB, 2024c). Altogether, the installation of grid-tied BESS, not only supports integration of renewable sources of energy to the grid, but is also crucial for grid stability in terms of voltage and frequency as well as to ensure that demand is meant at all times. However, the committed 80 MW BESS needs to be further increase over the years so as to sustain the intermittence from the anticipated increase in renewable energy installed capacity.
Central Electricity Board, 2024c. Battery Energy Storage System. Available at: https://ceb.mu/projects/battery-energy-storage-system
Design process
Having a systematic design approach and a robust methodology is crucial for any project as it enables:
- system design as per user’s needs;
- proper sizing and selection of components;
- validation of system designed;
- proactive identification and anticipation of project risks; and
- facilitation of project implementation, amongst others.
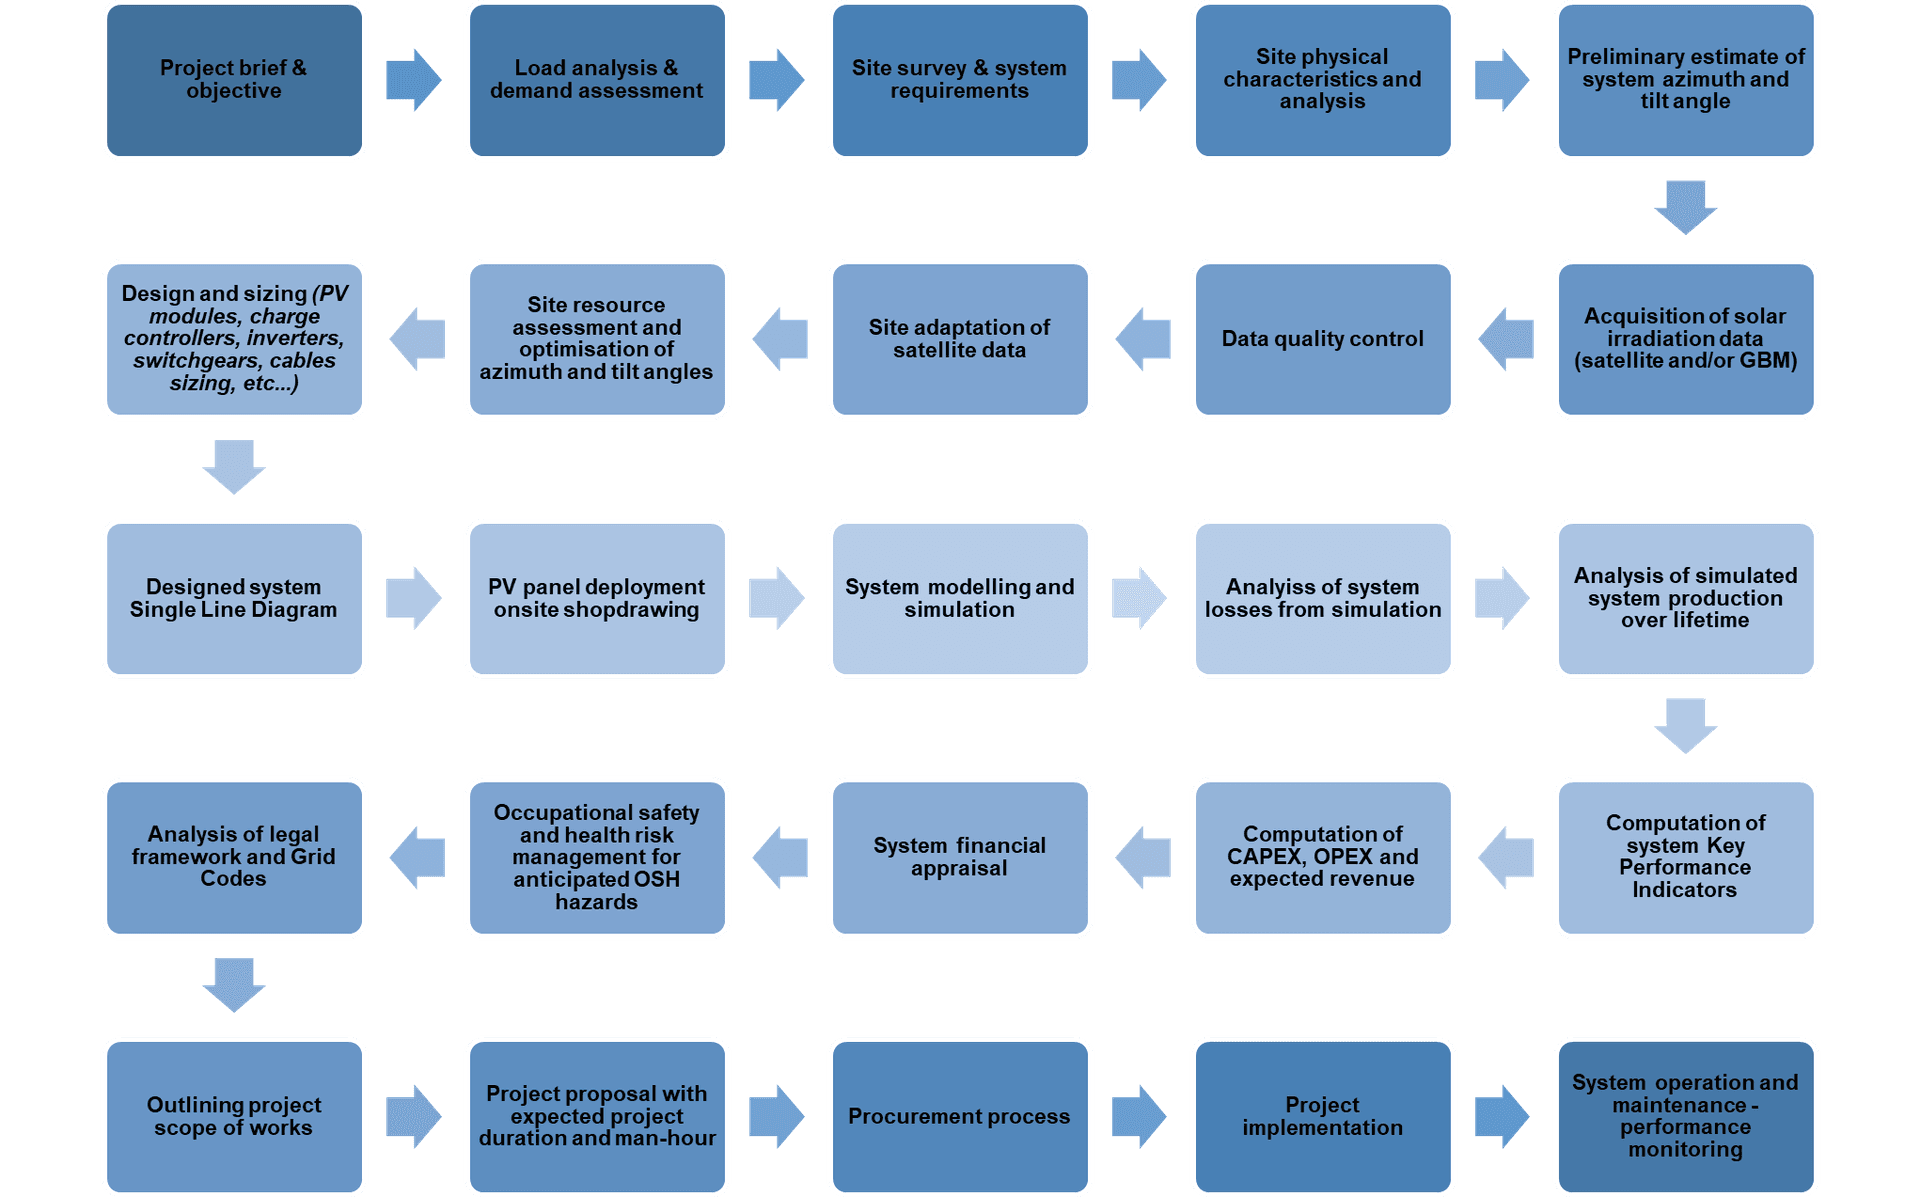
The figure below illustrates a comprehensive and recommended design approach for solar PV projects.
Design rules are:
- inverter maximum MPPT input current should be capable to withstand at least 125% of irradiance-adjusted (at max irradiance) Isc of PV string
- inverter maximum MPPT input current should be capable to withstand at least 125% of irradiance-adjusted (at max irradiance) Isc of PV string
- inverter maximum MPPT input current should be capable to withstand at least 125% of irradiance-adjusted (at max irradiance) Isc of PV string
- inverter maximum MPPT input current should be capable to withstand at least 125% of irradiance-adjusted (at max irradiance) Isc of PV string
- inverter maximum MPPT voltage should be capable to withstand at least 125% of adjusted (at safety Tmin) Voc of PV string
- inverter minimum MPPT voltage should be lower than adjusted (at safety Tmax) Vmpp of PV string
- PV string Voc should be within the inverter operating MPPT voltage range (minimum and maximum MPPT voltage)
- PV array capacity (system DC capacity) should be less than 115% of total inverter rated capacity (total AC capacity)
- switchgears (DC CB, fuse disconnect, MCB, MCCB) should be able to handle at least 156% (1.25 × 1.25) of the operating current to avoid nuisance trips from minor current fluctuations
- cables should be able to handle 156% of the operating current to avoid conductor overheating or meltdown in case of faults or malfunctions and the maximum permissible voltage drop across the cables should not exceed 3% of the nominal voltage and earthing system should not bear an earth resistance of more than 5 Ω and an earth loop impedance of not more than 10 Ω.
Further Reading
1. Bangarigadu, K., Hookoom, T., Ramgolam, Y.K. and Kune, N.F., 2021. Analysis of solar power and energy variability through site adaptation of satellite data with quality controlled measured solar radiation data. Journal of Solar Energy Engineering, 143(3), p.031008.
2. Hookoom, T., Bangarigadu, K. and Ramgolam, Y.K., 2022. Optimisation of geographically deployed PV parks for reduction of intermittency to enhance grid stability. Renewable Energy, 187, pp.1020-1036.
3. Ramgolam, Y.K. and Bangarigadu, K., 2018. Simple and effective method for evaluating performance of Si based photovoltaic cell technologies. AIMS Energy, 6(4).
4. Ramgolam, Y.K. and Chiniah, A., 2019, September. Innovative Architecture for Dynamic Solar Data Acquisition and Processing: A Case for Mauritius and Outer Islands. In 2019 Conference on Next Generation Computing Applications (NextComp) (pp. 1-6). IEEE.
5. Ramgolam, Y.K. and Needroo, A., 2013, September. Analysis of energy performance of households using energy performance indicators—A case study in Mauritius. In 2013 Africon (pp. 1-5). IEEE.
6. Ramgolam, Y.K. and Paddia, D., 2021, December. Investigating the effect of spectral changes on the electrical characteristics of Photovoltaic Technologies in Mauritius. In 2021 International Conference on Electrical, Computer and Energy Technologies (ICECET) (pp. 1-6). IEEE.
7. Ramgolam, Y.K. and Purbhoo, M., 2020, November. Investigating the effect of spectral changes on the electrical properties of Si, GaAs and CdTe solar cells. In 2020 3rd International Conference on Emerging Trends in Electrical, Electronic and Communications Engineering (ELECOM) (pp. 106-111). IEEE.
8. Ramgolam, Y.K. and Soyjaudah, K.M.S., 2015. Unveiling the solar resource potential for photovoltaic applications in Mauritius. Renewable Energy, 77, pp.94-100.
9. Ramgolam, Y.K. and Soyjaudah, K.M.S., 2016, April. Performance modelling and assessment of photovoltaic systems: A case for tropical region. In 2016 IEEE International Energy Conference (ENERGYCON) (pp. 1-5). IEEE.
10. Ramgolam, Y.K. and Soyjaudah, K.M.S., 2017. Holistic performance appraisal of a photovoltaic system. Renewable Energy, 109, pp.440-448.
11. Ramgolam, Y.K. and Soyjaudah, K.M.S., 2018. Modelling the impact of spectral irradiance and average photon energy on photocurrent of solar modules. Solar Energy, 173, pp.1058-1064.
12. Ramgolam, Y.K. and Thumiah, R., 2018. Stand-Alone Wind or Photovoltaic Power System: A Holistic Approach for System Design and Selection. The Nexus: Energy, Environment and Climate Change, pp.75-92.
13. Ramgolam, Y.K., Bangarigadu, K. and Hookoom, T., 2021. A robust methodology for assessing the effectiveness of site adaptation techniques for calibration of solar radiation data. Journal of Solar Energy Engineering, 143(3), p.031009.
14. Ramgolam, Y.K., Shamachurn, H. and Coret, J.Y., 2019, September. Energy Autonomous and Smart Outdoor PV Module Characterisation Facility. In 2019 Conference on Next Generation Computing Applications (NextComp) (pp. 1-6). IEEE.
15. Ramgolam, Y.K., Shamachurn, H. and Coret, J.Y., 2022. An In-Depth Experimental Investigation of the Outdoor Performance of Wafer and Thin Film Photovoltaics Technologies in a Tropical Climate. Journal of Solar Energy Engineering, 144(3), p.031005.
16. Ramgolam, Y.K., Sunnoo, D. and Chumun, U., 2013, September. Evaluating and optimizing the potential of photovoltaics in Mauritius. In 2013 Africon (pp. 1-5). IEEE.
17. Ramiah, C., Bangarigadu, K., Hookoom, T. and Ramgolam, Y.K., 2023. A novel and holistic framework for the selection of performance indicators to appraise photovoltaic systems. International solarr energy society: SWC2023 proceedings.
18. Ramiah, C., Dookhun, V., Ramgolam, Y.K. and Sultan, R., 2022, December. Risk Identification of the Solar PV Value Chain in Mauritius. In 2022 7th International Conference on Environment Friendly Energies and Applications (EFEA) (pp. 1-5). IEEE.
19. Shea, R.P. and Ramgolam, Y.K., 2019. Applied levelized cost of electricity for energy technologies in a small island developing state: A case study in Mauritius. Renewable energy, 132, pp.1415-1424.
20. Wahidna, A., Sookia, N. and Ramgolam, Y.K., 2024. Performance evaluation of artificial neural network and hybrid artificial neural network based genetic algorithm models for global horizontal irradiance forecasting. Solar Energy Advances, 4, p.100054.